- URL: https://www.laruence.com/en/2013/08/14/2899.html
- Please include attribution when republishing.
First off, it's been way too long since I updated the blog, so let me ramble a bit.
I always thought people would always manage to squeeze out time to blog, but now it seems I was wrong. It's not that I have nothing to share — it's that this past year I've genuinely been much busier. There's a lot of work on the job itself, and my spare time is filled up with PHP project stuff and Zend stuff. On top of that, the little reflections I have all get grumbled out on Weibo... so...
Anyway, big thanks to the friends who visit my blog often. But I'd suggest that if you have a question, don't put it in the comments — sometimes the blog marks them as SPAM. For small questions, you can @ me on Weibo @laruence
Back to the point: today I'm sharing a little tool I just made the day before yesterday. You can find the code on my GitHub: php-valgrind. This tool mainly gives PHP scripts the ability to turn on Valgrind (strictly speaking, Callgrind) profiling from within the script.
Generally, when we use Callgrind and want to analyze a particular function, we can use toggle-collect="function_name" to tell Callgrind to start profiling when it enters that function. But there's no way to analyze one specific segment of code this way..
Actually Callgrind provides a mechanism that lets us control when to start it from within the code: CALLGRIND_TOGGLE_COLLECT
For example:
#include <stdio.h>
#include <valgrind/callgrind.h>
void foo(int a[100]) {
    int i = 0;
}
int main (int argc, char **argv) {
    int i, a[100];
    CALLGRIND_START_INSTRUMENTATION;
    CALLGRIND_TOGGLE_COLLECT;
    for (i=0; i<100; i++) {
        a[i] = 2;
    }
    CALLGRIND_TOGGLE_COLLECT;
    CALLGRIND_STOP_INSTRUMENTATION;
    return;
}
Then, after compiling into a.out, we can analyze the profile info for this specific loop code segment:
$ valgrind --tool=callgrind --collect-atstart=no --instr-atstart=no ./a.out
The generated callgrind.out can then be analyzed by tools like callgrind_annotate, kcachegrind, etc.
$callgrind_annotate callgrind.out.27538
//OUTPUT:
--------------------------------------------------------------------------------
 Ir
---------------------------------------
617  PROGRAM TOTALS
---------------------------------------
 Ir  file:function
---------------------------------------
617  test.c:main [***dev/a.out]
Isn't that convenient?
But sometimes — for example when we're developing an extension, or doing some other kind of internal performance analysis — we need to be able to do this kind of triggering from within a PHP script too. And then there's no way. So I wrote this little tool, php-valgrind. After installing this extension, here's an example:
<?php
$a = array();
callgrind_toggle();
for ($i=0;$i<1000;$i++) {
    $a[$i] = 2;
}
callgrind_toggle();
Then we start analyzing:
$valgrind --tool=callgrind --collect-atstart=no --instr-atstart=no php /tmp/1.php
Then let's analyze the output:
-------------------------
       Ir
--------------------------
2,361,260  PROGRAM TOTALS
//the rest omitted
Then let's use qcachegrind (a GUI Callgrind analysis tool) to take a look:
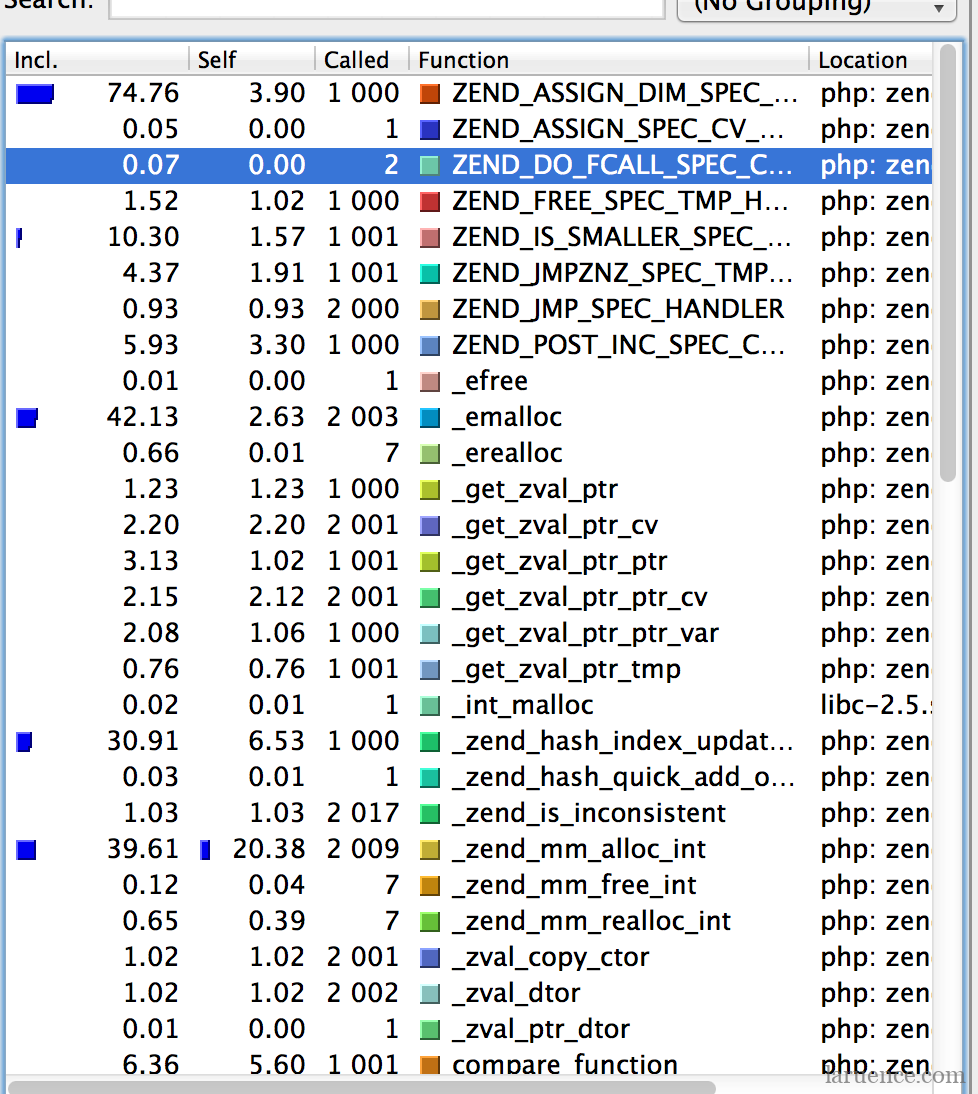
As you can see, the various instructions PHP needs to accomplish the same functionality are N times more than C (so of course it's slower than C.. heh, let me say it again: "C is the best language, no contest!")
OK, the tool introduction is done. If you're interested, go play with it. This tool can also be used to help us understand which underlying functions a piece of our PHP code will trigger, or which system calls, etc. Enjoy.
Be First to Comment