- URL: https://www.laruence.com/en/2020/06/27/5963.html
- Please include attribution when republishing.
PHP 8 alpha1 shipped yesterday. The JIT is surely the part everyone cares about most — so how do you actually use it, what should you watch out for, and how much faster does it make things?
Let's start with a diagram:
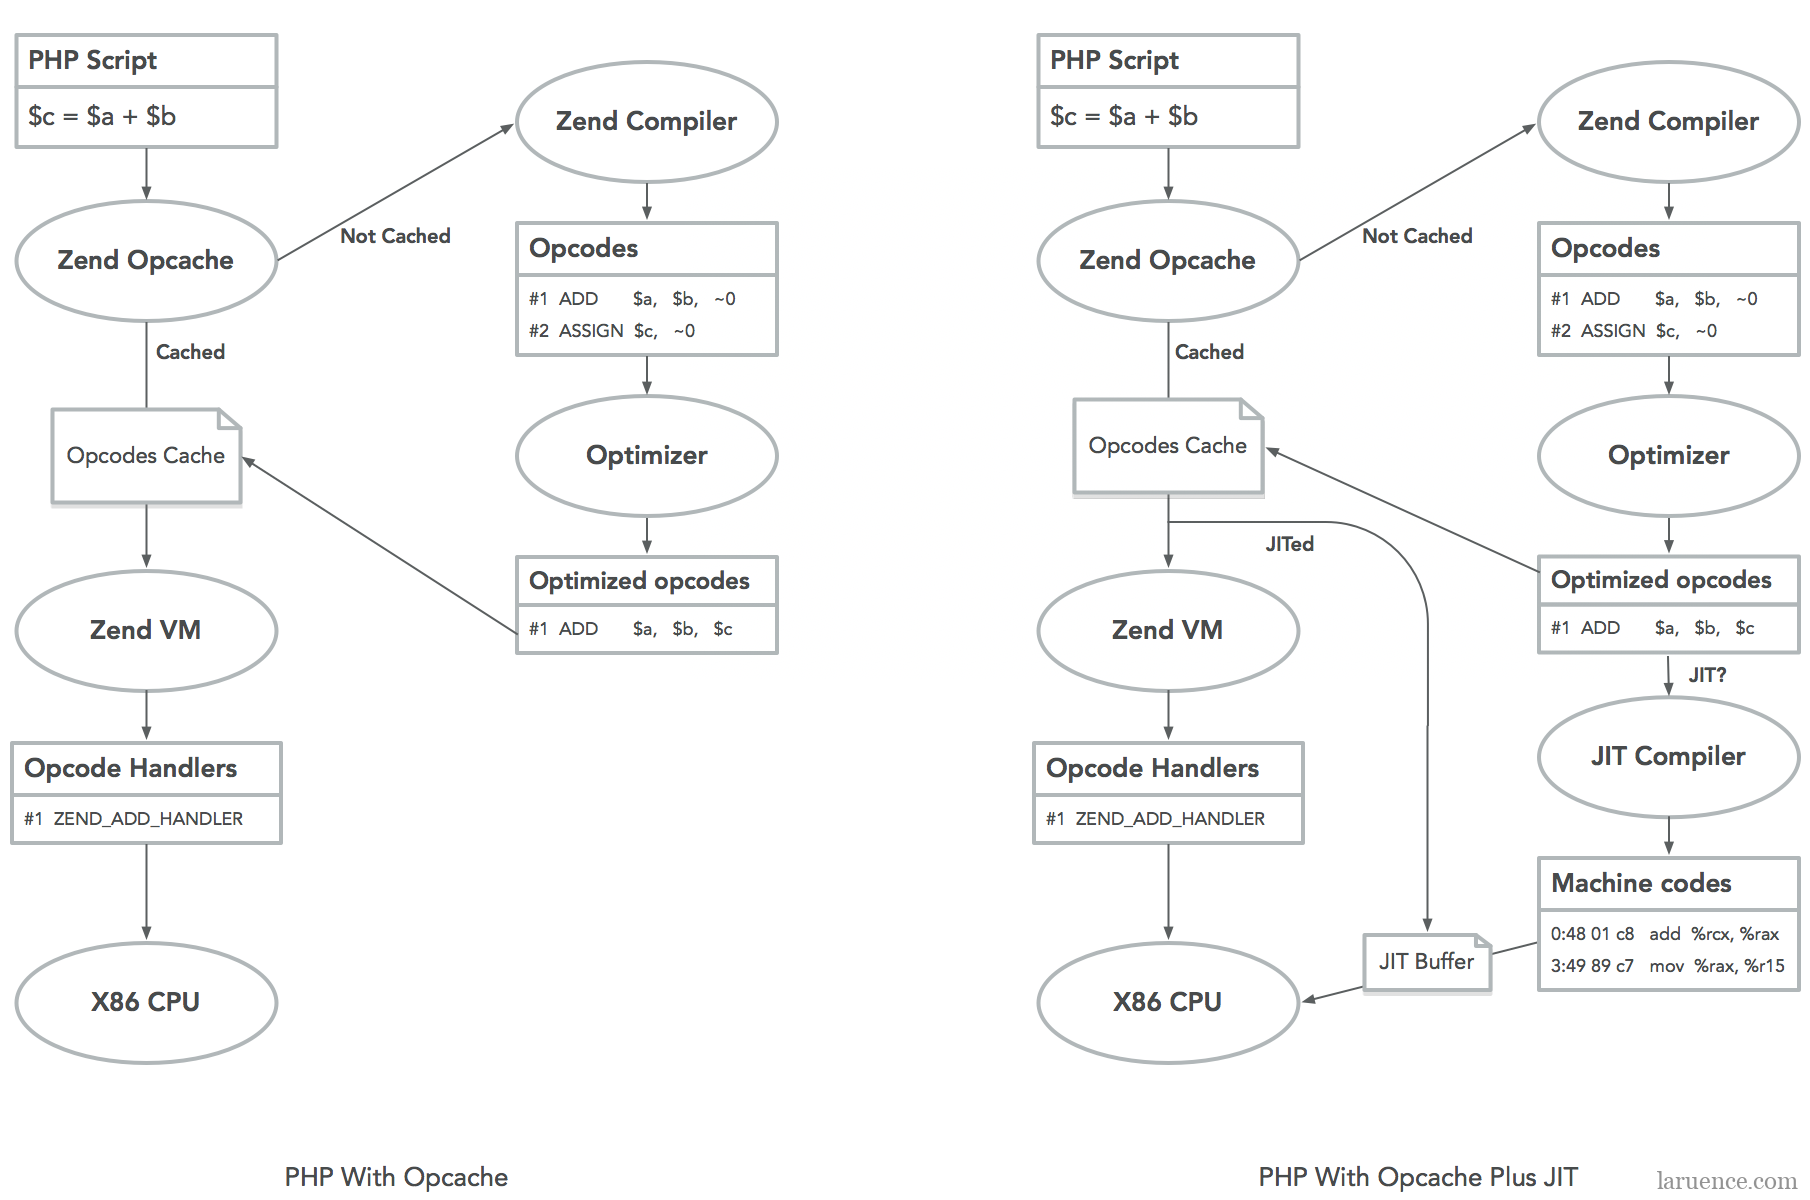
On the left: how Opcache worked before PHP 8. On the right: how it works in PHP 8. A few key points stand out:
- Opcache performs opcode-level optimizations — e.g. two opcodes in the figure merged into one
- PHP 8's JIT currently lives inside Opcache
- Building on Opcache's optimizations, the JIT optimizes again with runtime information and emits machine code directly
- The JIT doesn't replace Opcache's existing optimizations — it augments them
- PHP 8 currently supports x86 CPUs only
In fact, the JIT reuses much of the machinery Opcache already had for optimization — data flow graphs, call graphs, SSA, and so on. If I find the time, I'll cover that in a separate post; today is purely about how to use it.
After downloading and installing, beyond the usual opcache settings, we need to add the following to php.ini for the JIT:
opcache.jit=1205
opcache.jit_buffer_size=64M
The opcache.jit setting looks a bit complex; let me explain. It consists of 4 independent digits, from left to right (note: this reflects the current alpha1 settings — some options may be fine-tuned in later releases):
- Whether to use AVX instructions when generating machine code; requires CPU support:
0: don't use
1: use
- Register allocation strategy:
0: no register allocation
1: local (block-level) allocation
2: global (function-level) allocation
- JIT trigger strategy:
0: JIT when the PHP script is loaded
1: JIT a function the first time it executes
2: after one run, JIT the top (opcache.prof_threshold * 100) percent most-called functions
3: JIT a function/method after it has executed more than N times (N relates to opcache.jit_hot_func)
4: JIT a function/method whose doc comment contains @jit
5: JIT a trace after it has executed more than N times (relates to opcache.jit_hot_loop, jit_hot_return, etc.)
- JIT optimization level — the larger the number, the more aggressive the optimization:
0: no JIT
1: JIT the jumps between oplines
2: inline opcode handler calls
3: function-level JIT based on type inference
4: function-level JIT based on type inference and the call graph
5: script-level JIT based on type inference and the call graph
From this we can draw a few rough conclusions:
- Prefer a 12x5-style configuration; that should give the best results
- For x: use 0 for script-style workloads; for web services, pick 3 or 5 based on your test results
- The @jit form may become <<jit>> once attributes land
Now let's measure the difference in Zend/bench.php with and without the JIT. First, without (php -d opcache.jit_buffer_size=0 Zend/bench.php):
simple             0.008
simplecall         0.004
simpleucall        0.004
simpleudcall       0.004
mandel             0.035
mandel2            0.055
ackermann(7)       0.020
ary(50000)         0.004
ary2(50000)        0.003
ary3(2000)         0.048
fibo(30)           0.084
hash1(50000)       0.013
hash2(500)         0.010
heapsort(20000)    0.027
matrix(20)         0.026
nestedloop(12)     0.023
sieve(30)          0.013
strcat(200000)     0.006
------------------------
Total              0.387
Per the discussion above we choose opcache.jit=1205, since bench.php is a script (php -d opcache.jit_buffer_size=64M -d opcache.jit=1205 Zend/bench.php):
simple             0.002
simplecall         0.001
simpleucall        0.001
simpleudcall       0.001
mandel             0.010
mandel2            0.011
ackermann(7)       0.010
ary(50000)         0.003
ary2(50000)        0.002
ary3(2000)         0.018
fibo(30)           0.031
hash1(50000)       0.011
hash2(500)         0.008
heapsort(20000)    0.014
matrix(20)         0.015
nestedloop(12)     0.011
sieve(30)          0.005
strcat(200000)     0.004
------------------------
Total              0.157
As you can see, on Zend/bench.php, enabling the JIT cuts runtime by nearly 60% — roughly a 2x speedup.
For study and experimentation, you can watch the generated assembly via opcache.jit_debug. For example, given:
function simple() {
  $a = 0;
  for ($i = 0; $i < 1000000; $i++)
    $a++;
}
running php -d opcache.jit=1205 -dopcache.jit_debug=0x01 shows:
JIT$simple: ; (/tmp/1.php)
	sub $0x10, %rsp
	xor %rdx, %rdx
	jmp .L2
.L1:
	add $0x1, %rdx
.L2:
	cmp $0x0, EG(vm_interrupt)
	jnz .L4
	cmp $0xf4240, %rdx
	jl .L1
	mov 0x10(%r14), %rcx
	test %rcx, %rcx
	jz .L3
	mov $0x1, 0x8(%rcx)
.L3:
	mov 0x30(%r14), %rax
	mov %rax, EG(current_execute_data)
	mov 0x28(%r14), %edi
	test $0x9e0000, %edi
	jnz JIT$$leave_function
	mov %r14, EG(vm_stack_top)
	mov 0x30(%r14), %r14
	cmp $0x0, EG(exception)
	mov (%r14), %r15
	jnz JIT$$leave_throw
	add $0x20, %r15
	add $0x10, %rsp
	jmp (%r15)
.L4:
	mov $0x45543818, %r15
	jmp JIT$$interrupt_handler
Try reading this assembly: for the increment of i, the optimization is aggressive — i is a local variable allocated straight into a register, and range inference proves it never exceeds 1000000, so no integer-overflow check is needed, and so on.
If we instead use opcache.jit=1005 — no register allocation, per the earlier explanation — we get:
JIT$simple: ; (/tmp/1.php)
	sub $0x10, %rsp
	mov $0x0, 0x50(%r14)
	mov $0x4, 0x58(%r14)
	jmp .L2
.L1:
	add $0x1, 0x50(%r14)
.L2:
	cmp $0x0, EG(vm_interrupt)
	jnz .L4
	cmp $0xf4240, 0x50(%r14)
	jl .L1
	mov 0x10(%r14), %rcx
	test %rcx, %rcx
	jz .L3
	mov $0x1, 0x8(%rcx)
.L3:
	mov 0x30(%r14), %rax
	mov %rax, EG(current_execute_data)
	mov 0x28(%r14), %edi
	test $0x9e0000, %edi
	jnz JIT$$leave_function
	mov %r14, EG(vm_stack_top)
	mov 0x30(%r14), %r14
	cmp $0x0, EG(exception)
	mov (%r14), %r15
	jnz JIT$$leave_throw
	add $0x20, %r15
	add $0x10, %rsp
	jmp (%r15)
.L4:
	mov $0x44cdb818, %r15
	jmp JIT$$interrupt_handler
Notice the parts dealing with i now operate on memory, not registers.
And with opcache.jit=1201, we get:
JIT$simple: ; (/tmp/1.php)
	sub $0x10, %rsp
	call ZEND_QM_ASSIGN_NOREF_SPEC_CONST_HANDLER
	add $0x40, %r15
	jmp .L2
.L1:
	call ZEND_PRE_INC_LONG_NO_OVERFLOW_SPEC_CV_RETVAL_UNUSED_HANDLER
	cmp $0x0, EG(exception)
	jnz JIT$$exception_handler
.L2:
	cmp $0x0, EG(vm_interrupt)
	jnz JIT$$interrupt_handler
	call ZEND_IS_SMALLER_LONG_SPEC_TMPVARCV_CONST_JMPNZ_HANDLER
	cmp $0x0, EG(exception)
	jnz JIT$$exception_handler
	cmp $0x452a0858, %r15d
	jnz .L1
	add $0x10, %rsp
	jmp ZEND_RETURN_SPEC_CONST_LABEL
This is just simple inlining of some opcode handler calls.
You can also try the various opcache.jit strategies combined with the debug settings to observe the differences, and try different opcache.jit_debug values — for example 0xff, which prints plenty of auxiliary information.
That's the quick tour of using the JIT. As for the implementation details of the JIT itself, I'll write about those another time.
You can go download PHP 8 from php.net and test it right now. 🙂
thanks
Be First to Comment